
Tracking
Weight tracking and the forecast
How the trend line and its confidence band are fitted from your weigh-ins.
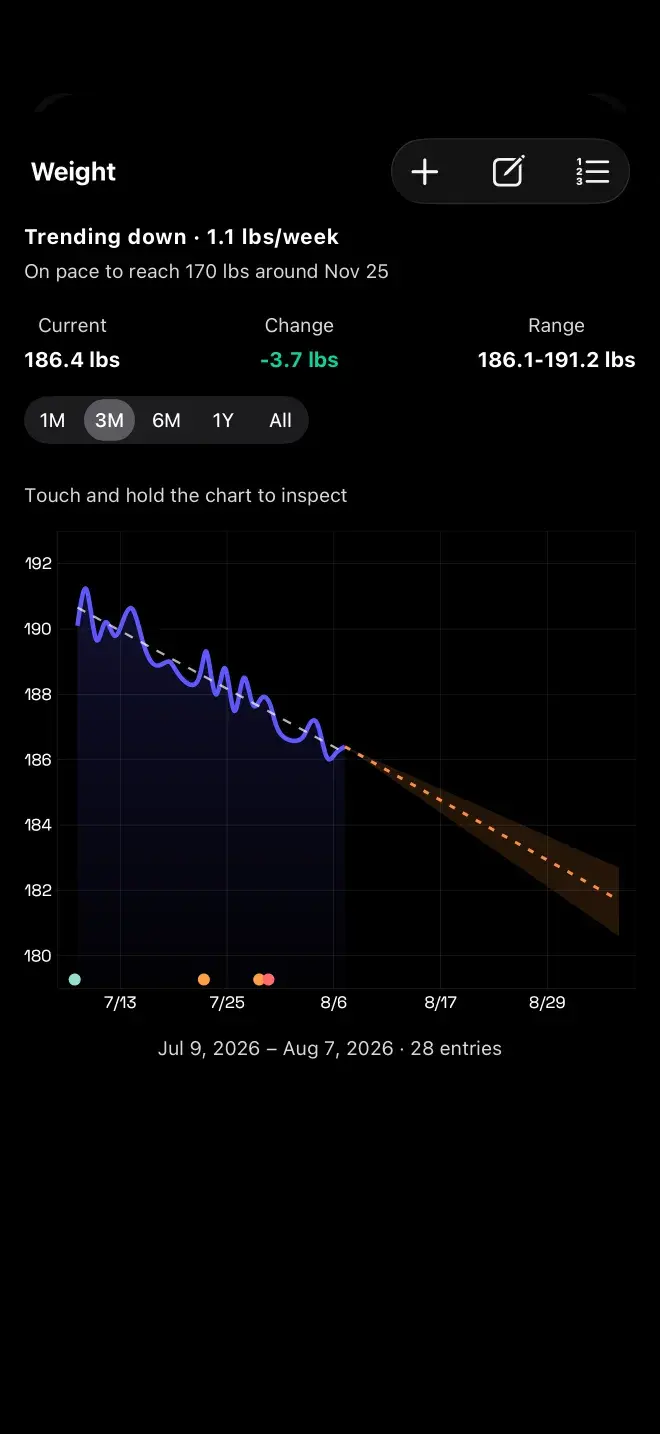
Log your weight regularly and Food Loops fits a trend line through the readings, projects it forward, and shows a confidence band around the projection.
Why a trend, not the raw number
Day-to-day scale weight moves with water, sodium, carbohydrate, digestion and hormones, and those swings are routinely larger than a week of genuine fat loss. Reading individual weigh-ins is mostly reading noise. The trend line is the signal.
How the forecast is fitted
The app takes your last 180 days of weigh-ins, removes statistical outliers, and fits an exponentially weighted least-squares regression — recent readings count for more than old ones, with a half-life of about two weeks. Around that line it draws a 95% prediction interval, which is the shaded band.
Confidence
The forecast is labeled high, medium or low confidence based on how many readings you have, how tightly they fit the line, how variable they are, how recently you last weighed in, and how long a period they span. When confidence is low, the app won't show a projected goal date at all rather than give you a number it doesn't believe.
Weigh yourself under the same conditions each time — first thing in the morning, after the bathroom, before eating. Consistency matters far more than the time of day you pick.
Previous
The NOVA scoreNext
Water trackingStill stuck? Get in touch.